ALERT: MetroLink Alert - 8th & Pine, Rock Road and Wellston Stations Read More!
x
< BACK TO SAFETY & SECURITY

Metro Transit Security Assessment

Since March 2018, we have been working closely with our partners at the East-West Gateway Council of Governments, St. Louis County Police Department, St. Louis Metropolitan Police Department, St. Clair County Sheriff’s Department, and security consultant WSP-USA to enhance safety and security efforts on the Metro Transit system and address regional concerns.

Using data, insights and recommendations developed through a system-wide security assessment, we have made improvements and enhancements to our approach to transit safety and security over the past two years, and will continue to make progress throughout 2020.

Read about the Metro Security Assessment and Strategy and the implementation of recommendations that are improving safety on the system.

Metro Security Scorecard

This scorecard provides a mechanism to track Metro’s progress toward implementing the comprehensive security strategy in each of six categories: Security Strategy, Police & Security Staffing, Procedures & Training, Fare & Fare Enforcement, Crime Prevention Through Environmental Design (CPTED), and Technology.
 

Second Quarter Security Scorecard Graphic

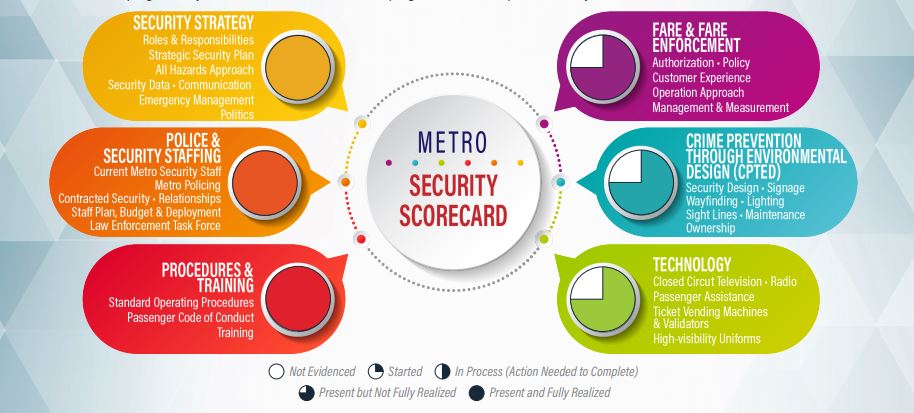
Download the booklet of Metro’s current scorecard and progress in each category (PDF)


MetroLink Task Force Reports

Nothing is more important than your safety. We are constantly upgrading and improving our safety and security measures while continuing to deliver the reliable, efficient service riders expect.

Ridership safety and security information prior to January 2021 is available on our Community Reports Archive.

The information provided below is ‘unofficial’ and not jurisdictional specific. Details or specifics related to the information would need to be obtained by contacting the individual police departments (St. Louis County, St. Louis City, and St. Clair County) for any ‘official’ data.

MetroLink Task Force Summary

Task Force Incidents

2022 2023
Quarter 1 160 236
Quarter 2 174 249
Quarter 3 178 228
Quarter 4 145

Proactive Policing

Q1 Q2 Q3 Q4
Directed 120 144 140
Proactive 116 105 88
Total 236 249 228

57% of Violent Crimes were Weapon Possession.

89% of Weapon Possession were a result of Proactive Policing.

Offense Types

Pie chart showing Offense Types handled by the MetroLink Task Force in Q3 of 2023. Standard of Conduct 48%; Property Crime 9%; Violent Crime 43%.
  • MetroLink boardings decreased 3% compared to Q3 2022.
  • Incidents per MetroLink boarding was .00013 (13 incidents per 100,000 boardings)
  • The Task Force has a total of 67 contracted police officers.
  • 19% of Task Force Incidents were warrant arrests, likely the result of proactivity and the removal of known offenders from the system.
  • Most of the Standard of Conduct offenses were trespassing violations (34%).

MetroLink Task Force Incidents

Line graph showing Monthly Incidents handled by the MetroLink Task Force. 3 lines plotted: Gray line: 2021. Yellow line: 2022. Blue line: 2023 (through Q3).
St. Louis County police badge

St. Louis County Incidents

2022 2023
Quarter 1 90 126
Quarter 2 101 119
Quarter 3 107 116
Quarter 4 67
  • St. Louis County Police Department has a total of 44 contracted police officers.
  • 69% of incident reports were self-initiated and generated by proactive policing.

Offense Types

Pie chart showing Offense Types handled by St. Louis County Police on MetroLink in Q3 of 2023. Standard of Conduct 46%; Property Crime 2%; Violent Crime 52%.
St. Louis County police badge

Incidents by Station

MetroLink Station 2022 2023
Shrewsbury 1
Sunnen 1
Maplewood 4
Brentwood 1 2
RIchmond Heights 1 5
Clayton 1 6
Forsyth 1
U-City/Big Bend
Skinker
Forest Park
Central West End
Cortex 1
Lambert Main 2 1
Lambert East 3
North Hanley 75 72
UMSL North 2 3
UMSL South 6 4
Rock Road 13 5
Wellston 4 9
Delmar Loop
Alignment
TOTAL 107 116

St. Louis County Incidents

Line graph showing Monthly Incidents on MetroLink handled by St. Louis County Police. 3 lines plotted: Gray line: 2021. Yellow line: 2022. Blue line: 2023 (through Q3).
St. Louis Metropolitan police badge

St. Louis City Incidents

2022 2023
Quarter 1 21 25
Quarter 2 16 22
Quarter 3 17 22
Quarter 4 20
  • St. Louis Metropolitan Police Department has a total of 8 contracted police officers.
  • 5% of incident reports were self-initiated and generated by proactive policing.

Offense Types

Pie chart showing Offense Types handled by St. Louis City Police on MetroLink in Q3 of 2023. Standard of Conduct 53%; Property Crime 14%; Violent Crime 33%.
St. Louis Metropolitan police badge

Incidents by Station

MetroLink Station 2022 2023
Shrewsbury 1 2
Skinker
Delmar Loop 2 1
Forest Park 4 2
Central West End 2 3
Cortex 2
Grand 2
Union Station
Civic Center 3 7
Stadium
8th & Pine 1
Convention Center 1 3
Landing 2 1
TOTAL 17 22

St. Louis City Incidents

Line graph showing Monthly Incidents on MetroLink handled by St. Louis City Police. 3 lines plotted: Gray line: 2021. Yellow line: 2022. Blue line: 2023 (through Q3).
St. Clair County Sheriff's badge

St. Clair County Incidents

2022 2023
Quarter 1 49 85
Quarter 2 57 108
Quarter 3 54 90
Quarter 4 58
  • St. Clair County Sheriff’s Department has a total of 15 contracted police officers.
  • 8% of incident reports were self-initiated and generated by proactive policing.

Offense Types

Pie chart showing Offense Types handled by St. Clair County Police on MetroLink in Q3 of 2023. Standard of Conduct 48%; Property Crime 26%; Violent Crime 26%.
St. Clair County Sheriff's badge

Incidents by Station

MetroLink Station 2022 2023
East Riverfront 3 4
5th & Missouri 7 14
Emerson Park 6 5
Jackie Joyner-Kersee 1 3
Washington Park 8 7
Fairview Heights 10 35
Memorial Hospital 9 6
Swansea 1 6
Belleville 3 3
College 2 3
Shiloh-Scott 3 2
Alignment 1 2
TOTAL 54 90

St. Clair County Incidents

Line graph showing Monthly Incidents on MetroLink handled by St. Clair County Sheriff's Department. 3 lines plotted: Gray line: 2021. Yellow line: 2022. Blue line: 2023 (through Q3).
MetroLink Task Force Summary

Task Force Incidents

2022 2023
Quarter 1 160 236
Quarter 2 174 249
Quarter 3 178
Quarter 4 145

Proactive Policing

Q1 Q2 Q3 Q4
Directed 120 144
Proactive 116 105
Total 236 249

Offense Types

Pie chart showing Offense Types handled by the MetroLink Task Force in Q2 of 2023. Standard of Conduct 58%; Property Crime 11%; Violent Crime 31%.
  • MetroLink boardings decreased 3% compared to Q2 2022.
  • Incidents per MetroLink boarding was .00014 (14 incidents per 100,000 boardings)
  • The Task Force has a total of 67 contracted police officers.
  • Nearly half (42%) of incident reports were self-initiated and generated by proactive policing.
  • Nearly a fourth (22%) of Task Force Incidents were warrant arrests, likely the result of proactivity and the removal of known offenders from the system.
  • Weapon violations accounted for 50% of the Violent Crime offense type, likely the result of proactive initiatives targeting known ‘hot spots’.
    • Possession of a weapon on Metro property is a criminal offense and is classified as a ‘Violent Crime’ due to the potential threat to personal safety.
  • Most of the Standard of Conduct offenses were trespassing violations (44%).

MetroLink Task Force Incidents

Line graph showing Monthly Incidents handled by the MetroLink Task Force. 3 lines plotted: Gray line: 2021. Yellow line: 2022. Blue line: 2023 (through Q2).
St. Louis County police badge

St. Louis County Incidents

2022 2023
Quarter 1 90 126
Quarter 2 101 119
Quarter 3 107
Quarter 4 67
  • St. Louis County Police Department has a total of 44 contracted police officers.
  • Most (74%) of incident reports were self-initiated and generated by proactive policing.

Offense Types

Pie chart showing Offense Types handled by St. Louis County Police on MetroLink in Q2 of 2023. Standard of Conduct 60%; Property Crime 12%; Violent Crime 28%.
St. Louis County police badge

Incidents by Station

MetroLink Station 2022 2023
Shrewsbury 1 2
Sunnen
Maplewood 8
Brentwood 9
RIchmond Heights 5
Clayton 1 21
Forsyth
U-City/Big Bend 1
Skinker
Forest Park
Central West End 1
Cortex
Lambert Main 4 5
Lambert East 1
North Hanley 66 52
UMSL North 4 1
UMSL South 5 5
Rock Road 11 3
Wellston 6 6
Delmar Loop 2
Alignment
TOTAL 101 119

St. Louis County Incidents

Line graph showing Monthly Incidents on MetroLink handled by St. Louis County Police. 3 lines plotted: Gray line: 2021. Yellow line: 2022. Blue line: 2023 (through Q2).
St. Louis Metropolitan police badge

St. Louis City Incidents

2022 2023
Quarter 1 21 25
Quarter 2 16 22
Quarter 3 17
Quarter 4 20
  • St. Louis Metropolitan Police Department has a total of 8 contracted police officers.
  • Nearly a fourth (23%) of incident reports were self-initiated and generated by proactive policing.

Offense Types

Pie chart showing Offense Types handled by St. Louis City Police on MetroLink in Q2 of 2023. Standard of Conduct 55%; Property Crime 4%; Violent Crime 41%.
St. Louis Metropolitan police badge

Incidents by Station

MetroLink Station 2022 2023
Shrewsbury
Skinker
Delmar Loop 2
Forest Park 2 5
Central West End 3 4
Cortex 1
Grand 1 1
Union Station 2 1
Civic Center 3 5
Stadium 1
8th & Pine 2
Convention Center
Landing 2 3
TOTAL 16 22

St. Louis City Incidents

Line graph showing Monthly Incidents on MetroLink handled by St. Louis City Police. 3 lines plotted: Gray line: 2021. Yellow line: 2022. Blue line: 2023 (through Q2).
St. Clair County Sheriff's badge

St. Clair County Incidents

2022 2023
Quarter 1 49 85
Quarter 2 57 108
Quarter 3 54
Quarter 4 58
  • St. Clair County Sheriff’s Department has a total of 15 contracted police officers.
  • 11% of incident reports were self-initiated and generated by proactive policing.

Offense Types

Pie chart showing Offense Types handled by St. Clair County Police on MetroLink in Q2 of 2023. Standard of Conduct 54%; Property Crime 14%; Violent Crime 32%.
St. Clair County Sheriff's badge

Incidents by Station

MetroLink Station 2022 2023
East Riverfront 1
5th & Missouri 9 18
Emerson Park 11 9
Jackie Joyner-Kersee 8 4
Washington Park 5 13
Fairview Heights 20 38
Memorial Hospital 2 8
Swansea 2 2
Belleville 3
College 1
Shiloh-Scott 10
Alignment 1
TOTAL 57 108

St. Clair County Incidents

Line graph showing Monthly Incidents on MetroLink handled by St. Clair County Sheriff's Department. 3 lines plotted: Gray line: 2021. Yellow line: 2022. Blue line: 2023 (through Q2).
MetroLink Task Force Summary

Task Force Incidents

2022 2023
Quarter 1 160 236
Quarter 2 174
Quarter 3 178
Quarter 4 145

Proactive Policing

Q1 Q2 Q3 Q4
Directed 120
Proactive 116
Total 236

Offense Types

Pie chart showing Offense Types handled by the MetroLink Task Force in Q1 of 2023. Standard of Conduct 63%; Property Crime 13%; Violent Crime 24%.
  • MetroLink boardings increased 14% compared to Q1 2022.
    • The Automatic Passenger Counting (APC) System experienced an outage; boardings for February 2023 were estimated using data from the previous month.
  • Incidents per MetroLink boarding was .00015 (15 incidents per 100,000 boardings)
  • Nearly half (49%) of incident reports were self-initiated and generated by proactive policing.
  • Nearly a third (27%) of Task Force Incidents were warrant arrest, likely the result of proactivity and the removal of known offenders from the system.
  • Weapon violations accounted for 34% of the Violent Crime offense type, likely the result of proactive initiatives targeting known ‘hot spots’.
    • Possession of a weapon on Metro property is a criminal offense and is classified as a ‘Violent Crime’ due to the potential threat to personal safety.
  • Most of the Standard of Conduct offenses were ordinance violations (28%) and drug violations (27%).

MetroLink Task Force Incidents

Line Graph showing Monthly Incidents handled by the MetroLink Task Force. 3 lines plotted: Gray line: 2021. Yellow line: 2022. Blue line: 2023 (Q1).
St. Louis County police badge

St. Louis County Incidents

2022 2023
Quarter 1 90 126
Quarter 2 101
Quarter 3 107
Quarter 4 67

Offense Types

Pie chart showing Offense Types handled by St. Louis County Police on MetroLink in Q1 of 2023. Standard of Conduct 76%; Property Crime 6%; Violent Crime 18%.
St. Louis County police badge

Incidents by Station

MetroLink Station 2022 2023
Shrewsbury 1
Sunnen 3
Maplewood 1 3
Brentwood 5
RIchmond Heights 1
Clayton 4
Forsyth 2
U-City/Big Bend
Skinker
Forest Park
Central West End
Cortex
Lambert Main 3
Lambert East
North Hanley 66 76
UMSL North 5 3
UMSL South 7 6
Rock Road 7 11
Wellston 4 8
Delmar Loop
TOTAL 90 126

St. Louis County Incidents

Line Graph showing Monthly Incidents on MetroLink handled by St. Louis County Police. 3 lines plotted: Gray line: 2021. Yellow line: 2022. Blue line: 2023 (Q1).
St. Louis Metropolitan police badge

St. Louis City Incidents

2022 2023
Quarter 1 21 25
Quarter 2 16
Quarter 3 17
Quarter 4 20

Offense Types

Pie chart showing Offense Types handled by St. Louis City Police on MetroLink in Q1 of 2023. Standard of Conduct 29%; Property Crime 19%; Violent Crime 52%.
St. Louis Metropolitan police badge

Incidents by Station

MetroLink Station 2022 2023
Shrewsbury 3 2
Skinker
Delmar Loop 3
Forest Park 1 3
Central West End 4
Cortex 2 1
Grand 2 4
Union Station 2 2
Civic Center 4 6
Stadium
8th & Pine 2
Convention Center 1
Landing 2 2
TOTAL 21 25

St. Louis City Incidents

Line Graph showing Monthly Incidents on MetroLink handled by St. Louis City Police. 3 lines plotted: Gray line: 2021. Yellow line: 2022. Blue line: 2023 (Q1).
St. Clair County Sheriff's badge

St. Clair County Incidents

2022 2023
Quarter 1 49 85
Quarter 2 57
Quarter 3 54
Quarter 4 58

Offense Types

Pie chart showing Offense Types handled by St. Clair County Police on MetroLink in Q1 of 2023. Standard of Conduct 48%; Property Crime 29%; Violent Crime 23%.
St. Clair County Sheriff's badge

Incidents by Station

MetroLink Station 2022 2023
East Riverfront 2
5th & Missouri 8 11
Emerson Park 7 8
Jackie Joyner-Kersee 2 8
Washington Park 5 8
Fairview Heights 13 22
Memorial Hospital 5 6
Swansea 2 5
Belleville 1 4
College 3 5
Shiloh-Scott 1 7
Alignment 1
TOTAL 49 85

St. Clair County Incidents

Line Graph showing Monthly Incidents on MetroLink handled by St. Clair County Sheriff's Department. 3 lines plotted: Gray line: 2021. Yellow line: 2022. Blue line: 2023 (Q1).
MetroLink Task Force Summary

Task Force Incidents

2021 2022
Quarter 1 137 160
Quarter 2 142 177
Quarter 3 153 178
Quarter 4 166 145

Offense Types

Pie chart showing percentage of "Offense Types" handled by the MetroLink Task Force in Q4 of 2022. Standard of Conduct: 70%; Property Crime: 6%; Violent Crime: 24%.
  • MetroLink boardings increased 7%
  • Incidents per MetroLink boarding was .00009 (9 incidents per 100,000 boardings)
  • The majority (50%) of incident reports were self-initiated and generated by proactive policing
  • Nearly a third (30%) of Task Force Incidents were warrant arrests, likely the result of proactivity and the removal of known offenders from the system
  • Weapons violations accounted for 32% of the Violent Crime offense type, likely the result of proactive initiatives targeting known ‘hot spots’
  • Nearly a third (31%) of Standard of Conduct offenses were trespassing; most were the proactive removal of known offenders in violation of the Ride & Abide Program.

MetroLink Task Force Incidents

Line Graph showing Monthly Incidents handled by the MetroLink Task Force. 3 lines plotted: Gray line: 2020. Yellow line: 2021. Blue line: 2022.
St. Louis County police badge

St. Louis County Incidents

2021 2022
Quarter 1 82 90
Quarter 2 90 104
Quarter 3 92 107
Quarter 4 73 67
  • St. Louis County MetroLink boardings increased 2%
  • Incidents per MetroLink boarding was .00012 (12 incidents per 100,000 MetroLink Boardings)

Offense Types

Pie chart showing percentage of "Offense Types" handled by St. Louis County Police on MetroLink in Q4 of 2022. Standard of Conduct: 73%; Property Crime: 4%; Violent Crime: 23%.
St. Louis County police badge

Incidents by Station

MetroLink Station 2021 2022
Shrewsbury 1 0
Sunnen 0 0
Maplewood 2 0
Brentwood 1 0
RIchmond Heights 1 0
Clayton 1 1
Forsyth 0 0
U-City/Big Bend 1 0
Skinker 0 0
Forest Park 0 0
Central West End 0 0
Cortex 0 0
Lambert Main 1 3
Lambert East 0 0
North Hanley 49 45
UMSL North 1 5
UMSL South 1 3
Rock Road 9 7
Wellston 4 2
Delmar Loop 1 1
TOTAL 73 67

St. Louis County Incidents

Line Graph showing Monthly Incidents on MetroLink handled by St. Louis County Police. 3 lines plotted: Gray line: 2020. Yellow line: 2021. Blue line: 2022.
St. Louis Metropolitan police badge

St. Louis City Incidents

2021 2022
Quarter 1 21 21
Quarter 2 10 16
Quarter 3 20 17
Quarter 4 10 20
  • St. Louis City MetroLink boardings increased 14%
  • Incidents per MetroLink boarding was .00003 (3 incidents per 100,000 MetroLink Boardings)
  • Assaults accounted for 5 of the 8 violent crime offenses

Offense Types

Pie chart showing percentage of "Offense Types" handled by St. Louis City Police on MetroLink in Q4 of 2022. Standard of Conduct: 53%; Property Crime: 5%; Violent Crime: 42%.
St. Louis Metropolitan police badge

Incidents by Station

MetroLink Station 2021 2022
Lambert Main 0 1
Shrewsbury 1 3
Skinker 1 0
Delmar Loop 1 2
Forest Park 1 3
Central West End 0 0
Cortex 2 0
Grand 0 3
Union Station 0 2
Civic Center 4 4
Stadium 0 0
8th & Pine 0 2
Convention Center 0 0
Landing 0 0
TOTAL 10 20

St. Louis City Incidents

Line Graph showing Monthly Incidents on MetroLink handled by St. Louis City Police. 3 lines plotted: Gray line: 2020. Yellow line: 2021. Blue line: 2022.
St. Clair County Sheriff's badge

St. Clair County Incidents

2021 2022
Quarter 1 34 49
Quarter 2 42 57
Quarter 3 41 54
Quarter 4 83 58
  • St. Clair County MetroLink boardings increased 1%
  • Incidents per MetroLink boarding was .00017 (17 incidents per 100,000 MetroLink Boardings)
  • Nearly 50% of the incidents in Q4 were warrant arrests

Offense Types

Pie chart showing percentage of "Offense Types" handled by St. Clair County Police on MetroLink in Q4 of 2022. Standard of Conduct: 62%; Property Crime: 10%; Violent Crime: 29%.
St. Clair County Sheriff's badge

Incidents by Station

MetroLink Station 2021 2022
East Riverfront 4 0
5th & Missouri 13 7
Emerson Park 16 3
Jackie Joyner-Kersee 3 5
Washington Park 11 4
Fairview Heights 25 18
Memorial Hospital 1 7
Swansea 2 2
Bellville 6 3
College 1 3
Shiloh-Scott 1 5
Alignment 0 1
TOTAL 83 58

St. Clair County Incidents

Line Graph showing Monthly Incidents on MetroLink handled by St. Clair County Police. 3 lines plotted: Gray line: 2020. Yellow line: 2021. Blue line: 2022.
MetroLink Task Force Summary

Task Force Incidents

2021 2022
Quarter 1 137 160
Quarter 2 142 177
Quarter 3 153 178
Quarter 4 166

Offense Types

Pie chart showing percentage of "Offense Types" handled by the MetroLink Task Force in Q3 of 2022. Standard of Conduct: 64%; Property Crime: 8%; Violent Crime: 29%.
  • MetroLink boardings increased 7%
  • Incidents per MetroLink boarding was .0001 (10 incidents per 100,000 boardings)
  • The majority (62%) of incident reports were self-initiated and generated by proactive policing
  • Nearly a third (28%) of Task Force Incidents were warrant arrests, likely the result of proactivity and the removal of known offenders from the system
  • Weapons violations accounted for 47% of the Violent Crime offense type, likely the result of proactive initiatives targeting known ‘hot spots’
  • Nearly a third (26%) of Standard of Conduct offenses were drug violations

MetroLink Task Force Incidents

Line Graph showing Monthly Incidents handled by the MetroLink Task Force. 3 lines plotted: Gray line: 2020. Yellow line: 2021. Blue line: 2022 through Q3.
St. Louis County police badge

St. Louis County Incidents

2021 2022
Quarter 1 82 90
Quarter 2 90 104
Quarter 3 92 107
Quarter 4 73
  • St. Louis County MetroLink boardings did not increase/decrease
  • Incidents per MetroLink boarding was .00019 (19 incidents per 100,000 MetroLink Boardings)

Offense Types

Pie chart showing percentage of "Offense Types" handled by St. Louis County Police on MetroLink in Q3 of 2022. Standard of Conduct: 77%; Property Crime: 4%; Violent Crime: 19%.
St. Louis County police badge

Incidents by Station

MetroLink Station 2021 2022
Shrewsbury 0 1
Sunnen 3 0
Maplewood 1 0
Brentwood 2 1
RIchmond Heights 2 1
Clayton 4 1
Forsyth 2 0
U-City/Big Bend 0 0
Skinker 0 0
Forest Park 2 0
Central West End 0 0
Cortex 0 1
Lambert Main 1 2
Lambert East 0 0
North Hanley 58 75
UMSL North 0 2
UMSL South 3 6
Rock Road 8 13
Wellston 3 4
Delmar Loop 3 0
TOTAL 92 107

St. Louis County Incidents

Line Graph showing Monthly Incidents on MetroLink handled by St. Louis County Police. 3 lines plotted: Gray line: 2020. Yellow line: 2021. Blue line: 2022 through Q3.
St. Louis Metropolitan police badge

St. Louis City Incidents

2021 2022
Quarter 1 21 21
Quarter 2 10 16
Quarter 3 20 17
Quarter 4 10
  • St. Louis City MetroLink boardings increased 12%
  • Incidents per MetroLink boarding was .00002 (2 incidents per 100,000 MetroLink Boardings)

Offense Types

Pie chart showing percentage of "Offense Types" handled by St. Louis City Police on MetroLink in Q3 of 2022. Standard of Conduct: 53%; Property Crime: 18%; Violent Crime: 29%.
St. Louis Metropolitan police badge

Incidents by Station

MetroLink Station 2021 2022
Shrewsbury 1 1
Skinker 0 0
Delmar Loop 1 2
Forest Park 3 4
Central West End 4 2
Cortex 3 2
Grand 3 0
Union Station 1 0
Civic Center 1 3
Stadium 5 0
8th & Pine 1 0
Convention Center 1 1
Landing 2 2
TOTAL 20 17

St. Louis City Incidents

Line Graph showing Monthly Incidents on MetroLink handled by St. Louis City Police. 3 lines plotted: Gray line: 2020. Yellow line: 2021. Blue line: 2022 through Q3.
St. Clair County Sheriff's badge

St. Clair County Incidents

2021 2022
Quarter 1 34 49
Quarter 2 42 57
Quarter 3 41 54
Quarter 4 83
  • St. Clair County MetroLink boardings increased 8%
  • Incidents per MetroLink boarding was .00014 (14 incidents per 100,000 MetroLink Boardings)
  • Nearly 50% of the incidents in Q3 were warrant arrests

Offense Types

Pie chart showing percentage of "Offense Types" handled by St. Clair County Police on MetroLink in Q3 of 2022. Standard of Conduct: 44%; Property Crime: 13%; Violent Crime: 43%.
St. Clair County Sheriff's badge

Incidents by Station

MetroLink Station 2021 2022
East Riverfront 2 3
5th & Missouri 8 7
Emerson Park 8 6
Jackie Joyner-Kersee 2 1
Washington Park 2 8
Fairview Heights 16 10
Memorial Hospital 1 9
Swansea 1 1
Bellville 0 3
College 1 2
Shiloh-Scott 0 3
Alignment 0 1
TOTAL 41 54

St. Clair County Incidents

Line Graph showing Monthly Incidents on MetroLink handled by St. Clair County Police. 3 lines plotted: Gray line: 2020. Yellow line: 2021. Blue line: 2022 through Q3.
MetroLink Task Force Summary

Task Force Incidents

2021 2022
Quarter 1 137 160
Quarter 2 142 177
Quarter 3 153
Quarter 4 166

Offense Types

2022-Q2 MetroLink Offense Chart. Standard of Conduct: 62%; Property Crime: 4%; Violent Crime: 34%.
  • MetroLink boardings increased 18%
  • MetroLink boardings increased 26%
  • Incidents per MetroLink boarding is .0001 (10 incidents per 100,000 boardings)
  • The majority (71%) of incident reports were self initiated and generated by proactive policing.
  • Nearly a third 28%) of Task Force Incidents were warrant arrest, likely the result of proactivity and the removal of known offenders from the system.
  • Weapon violations account for 44% of the violent offense types. Likely the result of pro active initiatives targeting known ‘hot spots.’
  • A third (33%) of standard of conduct offenses are drug violations.

MetroLink Task Force Incidents

2022-Q2 MetroLink Incidents Chart for years 2020, 2021 and 2022.
St. Louis County police badge

St. Louis County Incidents

2021 2022
Quarter 1 82 90
Quarter 2 90 104
Quarter 3 92
Quarter 4 73
  • St. Louis County MetroLink boardings increased 25%
  • Incident per MetroLink boarding is .00017 (17 incidents per 100,000 MetroLink Boardings)

Offense Types

2022-Q2 St. Louis County Offense Chart. Standard of Conduct: 67%; Property Crime: 2%; Violent Crime: 31%.
St. Louis County police badge

Incidents by Station

MetroLink Station 2021 2022
Shresbury 0 1
Sunnen 2
Maplewood 3
Brentwood 1
RIchmond Heights 1
Clayton 3 1
Forsyth
U-City/Big Bend
Skinker
Forest Park
Central West End 1
Lambert Main 1 4
Lambert East
North Hanley 54 68
UMSL North 4
UMSL South 9 5
Rock Road 7 12
Wellston 7 6
Delmar Loop 1 2
Alignment 1
TOTAL 90 104

St. Louis County Incidents

2022-Q2 St. Louis County Incidents Chart for years 2020, 2021 and 2022.
St. Louis Metropolitan police badge

St. Louis City Incidents

2021 2022
Quarter 1 21 21
Quarter 2 10 16
Quarter 3 20
Quarter 4 10
  • St. Louis City MetroLink boardings increased 29%
  • Incident per MetroLink boarding is .00002 (2 incidents per 100,000 MetroLink Boardings)

Offense Types

2022-Q2 St. Louis City Offense Chart. Standard of Conduct: 53%; Property Crime: 6%; Violent Crime: 41%.
St. Louis Metropolitan police badge

Incidents by Station

MetroLink Station 2021 2022
Shrewsbury 1
Skinker
Delmar Loop 1 2
Forest Park 1 2
Central West End 1 1
Cortex 1 1
Grand 2 1
Union Station 1 2
Civic Center 1 3
Stadium
8th & Pine
Convention Center
Landing 1 2
TOTAL 10 16

St. Louis City Incidents

2022-Q2 St. Louis City Incidents Chart for years 2020, 2021 and 2022.
St. Clair County Sheriff's badge

St. Clair County Incidents

2021 2022
Quarter 1 34 49
Quarter 2 42 57
Quarter 3 41
Quarter 4 83
  • St. Clair County MetroLink boardings increased 24%
  • Incident per MetroLink boarding is .00014 (14 incidents per 100,000 MetroLink Boardings)
  • Nearly 50% of the incidents in Q2 were warrant arrests

Offense Types

2022-Q2 St. Clair County Offense Chart. Standard of Conduct: 54%; Property Crime:8%; Violent Crime: 38%.
St. Clair County Sheriff's badge

Incidents by Station

MetroLink Station 2021 2022
East Riverfront 2
5th & Missouri 9 9
Emerson Park 7 11
Jackie Joyner-Kersee 1 8
Washington Park 4 5
Fairview Heights 13 20
Memorial Hospital 2
Swansea 1 2
Bellville 3
College 1
Shiloh-Scott 1
Alignment
TOTAL 42 57

St. Clair County Incidents

2022-Q2 St. Clair County Incidents Chart for years 2020, 2021 and 2022.
MetroLink Task Force Summary

Task Force Incidents

2021 2022
Quarter 1 137 160
Quarter 2 143
Quarter 3 153
Quarter 4 166

Offense Types

2022-Q1 MetroLink Offense Chart. Standard of Conduct: 23%; Property Crime: 14%; Violent Crime: 63%.
  • MetroLink boardings increased 18%
  • Incidents per MetroLink boarding is .00011 (11 incidents per 100,000 boardings)
  • The majority (61%) of incident reports were self initiated and generated by proactive policing.
  • Nearly a third 30%) of Task Force Incidents were warrant arrest, likely the result of proactivity and the removal of known offenders from the system.
  • Weapon violations account for 58% of the violent offense types. Likely the result of pro active initiatives targeting known ‘hot spots.’
  • The majority of standard of conduct offenses are trespassing and drug violations.

MetroLink Task Force Incidents

2022-Q1 MetroLink Incidents Chart for years 2020, 2021 and 2022.
St. Louis County police badge

St. Louis County Incidents

2021 2022
Quarter 1 84 90
Quarter 2 91
Quarter 3 92
Quarter 4 73
  • St. Louis County MetroLink boardings increased 16%
  • Incident per MetroLink boarding is .00017 (17 incidents per 100,000 MetroLink Boardings)

Offense Types

2022-Q1 St. Louis County Offense Chart. Standard of Conduct: 64%; Property Crime: 6%; Violent Crime: 30%.
St. Louis County police badge

Incidents by Station

MetroLink Station 2021 2022
Shrewsbury 1
Sunnen
Maplewood 1 1
Brentwood 1
Richmond Heights 1
Clayton 1
Forsyth 1
U-City/Big Bend 1
Skinker
Forest Park
Lambert Main 1
Lambert East
North Hanley 56 66
UMSL North 5
UMSL South 4 7
Rock Road 13 7
Wellston 3 4
Delmar Loop
TOTAL 84 90

St. Louis County Incidents

2022-Q1 St. Louis County Incidents Chart for years 2020, 2021 and 2022.
St. Louis Metropolitan police badge

St. Louis City Incidents

2021 2022
Quarter 1 21 21
Quarter 2 10
Quarter 3 20
Quarter 4 10
  • St. Louis City MetroLink boardings increased 20%
  • Incident per MetroLink boarding is .00003 (3 incidents per 100,000 MetroLink Boardings)

Offense Types

2022-Q1 St. Louis City Offense Chart. Standard of Conduct: 23%; Property Crime: 23%; Violent Crime: 55%.
St. Louis Metropolitan police badge

Incidents by Station

MetroLink Station 2021 2022
Shrewsbury 2 3
Skinker
Delmar Loop 2 3
Forest Park 4 1
Central West End
Cortex 2 2
Grand 6 2
Union Station 2
Civic Center 4 4
Stadium
8th & Pine 2
Convention Center
Landing 1 2
TOTAL 21 21

St. Louis City Incidents

2022-Q1 St. Louis City Incidents Chart for years 2020, 2021 and 2022.
St. Clair County Sheriff's badge

St. Clair County Incidents

2021 2022
Quarter 1 34 49
Quarter 2 42
Quarter 3 41
Quarter 4 83
  • St. Clair County MetroLink boardings increased 15%
  • Incident per MetroLink boarding is .00016 (16 incidents per 100,000 MetroLink Boardings)
  • Nearly 50% of the incidents in Q1 were warrant arrests

Offense Types

2022-Q1 St. Clair County Offense Chart. Standard of Conduct: 29%; Property Crime:0%; Violent Crime: 71%.
St. Clair County Sheriff's badge

Incidents by Station

MetroLink Station 2021 2022
East Riverfront 2 2
5th & Missouri 2 8
Emerson Park 5 7
Jackie Joyner-Kersee 1 2
Washington Park 3 5
Fairview Heights 13 13
Memorial Hospital 2 5
Swansea 1 2
Belleville 2 1
College 1 3
Shiloh-Scott 2 1
Alignment
TOTAL 34 49

St. Clair County Incidents

2022-Q1 St. Clair County Incidents Chart for years 2020, 2021 and 2022.
MetroLink Task Force Summary

Task Force Incidents

2020 2021
Quarter 1 206 139
Quarter 2 68 143
Quarter 3 128 153
Quarter 4 103 166

Offense Types

2021-Q4 MetroLink Offense Chart. Standard of Conduct: 64%; Property Crime: 6%; Violent Crime: 30%.
  • MetroLink boardings increased 14%.
  • Incidents per MetroLink boarding is .00011 (11 incidents per 100,000 boardings).
  • The majority (66%) of incident reports were self initiated and generated by proactive policing.
  • Over a third (37%) of Task Force Incidents were warrant arrest, likely the result of proactivity and the removal of know offenders from the system.
  • Weapon violations account for 17% of the violent offense types. Likely the result of pro active initiatives targeting known ‘hot spots.’
  • The majority of standard of conduct offenses are trespassing and drug violations.

MetroLink Task Force Incidents

2021-Q4 MetroLink Taskforce Summary Incidents Chart for years 2020 and 2021
St. Louis County police badge

St. Louis County Incidents

2020 2021
Quarter 1 111 84
Quarter 2 18 91
Quarter 3 76 92
Quarter 4 63 73
  • St. Louis County MetroLink boardings increased 13%.
  • Incident per MetroLink boarding is .00013 (13 incidents per 100,000 MetroLink Boardings).

Offense Types

2021-Q4 St. Louis County Offense Chart. Standard of Conduct: 68%; Property Crime: 3%; Violent Crime: 29%.
St. Louis County police badge

Incidents by Station

MetroLink Station 2020 2021
Shrewsbury 2 1
Sunnen
Maplewood 1 2
Brentwood 1 1
Richmond Heights 1 1
Clayton 3 1
Forsyth 1
U-City/Big Bend 1 1
Skinker
Forest Park
Lambert Main 1 1
Lambert East
North Hanley 36 49
UMSL North 3 1
UMSL South 1
Rock Road 12 9
Wellston 1 4
Delmar Loop 1
TOTAL 63 73

St. Louis County Incidents

2021-Q4 St. Louis County Incidents Chart for years 2020 and 2021.
St. Louis Metropolitan police badge

St. Louis City Incidents

2020 2021
Quarter 1 36 21
Quarter 2 22 10
Quarter 3 15 20
Quarter 4 19 10
  • St. Louis City MetroLink boardings increased 17%
  • Incident per MetroLink boarding is .00002 (2 incidents per 100,000 MetroLink Boardings)

Offense Types

2021-Q4 St. Louis City Offense Chart. Standard of Conduct: 45%; Property Crime: 0%; Violent Crime: 55%.
St. Louis Metropolitan police badge

Incidents by Station

MetroLink Station 2020 2021
Shrewsbury 1
Skinker 1
Delmar Loop 1 1
Forest Park 2 1
Central West End
Cortex 2 2
Grand 3
Union Station 1
Civic Center 6 4
Stadium
8th & Pine 2
Convention Center
Landing
TOTAL 17 10

St. Louis City Incidents

2021-Q4 St. Louis City Incidents Chart for years 2020 and 2021.
St. Clair County Sheriff's badge

St. Clair County Incidents

2020 2021
Quarter 1 59 34
Quarter 2 28 42
Quarter 3 36 41
Quarter 4 21 83
  • St. Clair County MetroLink boardings increased 12%.
  • Incident per MetroLink boarding is .00024 (24 incidents per 100,000 MetroLink Boardings).
  • Nearly 60% of the incidents in Q4 were warrant arrests.

Offense Types

2021-Q4 St. Clair County Offense Chart. Standard of Conduct: 64%; Property Crime: 14%; Violent Crime: 22%.
St. Clair County Sheriff's badge

Incidents by Station

MetroLink Station 2020 2021
East Riverfront 4
5th & Missouri 4 13
Emerson Park 4 15
Jackie Joyner-Kersee 3
Washington Park 1 11
Fairview Heights 9 25
Memorial Hospital 1 1
Swansea 2
Belleville 6
College 1
Shiloh-Scott 2 1
Alignment
TOTAL 21 83

St. Clair County Incidents

2021-Q4 St. Clair County Incidents Graph for years 2020 and 2021.
MetroLink Task Force Summary

Task Force Incidents

2020 2021
Quarter 1 206 139
Quarter 2 68 143
Quarter 3 128 153
Quarter 4 103

Offense Types

2021-Q3 MetroLink Offense Pie Chart. Standard of Conduct: 81%; Property Crime: 4%; Violent Crime: 15%.
  • COVID-19 reached the Bi-State region mid/late March 2020. MetroLink ridership decreased during Q2 & Q3 as many schools/businesses closed or operated remotely.
  • Police limited exposure to the virus by reducing patrols and focusing on dispatched calls for service. The decrease in ridership and the reduction of proactive policing resulted in fewer incident reports for Q3 2020
  • MetroLink boardings increased 15%
  • Incidents per MetroLink boarding is .00009 (9 incidents per 100,000 boardings)
  • 65% of incident reports were the result of self initiation/proactive policing
  • Weapon violations account for 20% of the violent offense types Likely the result of proactive initiatives targeting known ‘hot spots.’
  • The majority of standard of conduct offenses are drug, trespassing, and ordinance violations.

MetroLink Task Force Incidents

2021-Q3 MetroLink Taskforce Summary Incidents Chart for years 2020 and 2021
St. Louis County police badge

St. Louis County Incidents

2020 2021
Quarter 1 111 84
Quarter 2 18 91
Quarter 3 76 92
Quarter 4 63
  • St. Louis County MetroLink boardings increased 11%
  • Incident per MetroLink boarding is .00016 (16 incidents per 100,000 MetroLink Boardings)

Offense Types

2021-Q3 St. Louis County Offense Pie Chart. Standard of Conduct: 83%; Property Crime: 3%; Violent Crime: 14%.
St. Louis County police badge

Incidents by Station

MetroLink Station 2020 2021
Shrewsbury 1
Sunnen 3
Maplewood 1
Brentwood 2 2
Richmond Heights 2
Clayton 2 4
Forsyth 2
U-City/Big Bend 1
Skinker
Forest Park 2
Lambert Main 2 1
Lambert East
North Hanley 57 58
UMSL North 1
UMSL South 1 3
Rock Road 7 8
Wellston 2 3
Delmar Loop 3
TOTAL 76 92

St. Louis County Incidents

2021-Q3 St. Louis County Incidents Chart for years 2020 and 2021.
St. Louis Metropolitan police badge

St. Louis City Incidents

2020 2021
Quarter 1 36 21
Quarter 2 22 10
Quarter 3 15 20
Quarter 4 19
  • St. Louis City MetroLink boardings increased 20%
  • Incident per MetroLink boarding is .00003 (3 incidents per 100,000 MetroLink Boardings)

Offense Types

2021-Q3 St. Louis City Offense Pie Chart. Standard of Conduct: 70%; Property Crime: 4%; Violent Crime: 26%.
St. Louis Metropolitan police badge

Incidents by Station

MetroLink Station 2020 2021
Shrewsbury 1
Skinker
Delmar Loop 1
Forest Park 6 3
Central West End 2 4
Cortex 2 2
Grand 3 3
Union Station 1
Civic Center 1 1
Stadium 1
8th & Pine 1
Convention Center 1
Landing 2
TOTAL 15 20

St. Louis City Incidents

2021-Q3 St. Louis City Incidents Chart for years 2020 and 2021.
St. Clair County Sheriff's badge

St. Clair County Incidents

2020 2021
Quarter 1 59 34
Quarter 2 28 42
Quarter 3 36 41
Quarter 4 21
  • St. Clair County MetroLink boardings increased 11%
  • Incident per MetroLink boarding is .00011 (11 incidents per 100,000 MetroLink Boardings)

Offense Types

2021-Q3 St. Clair County Offense Pie Chart. Standard of Conduct: 86%; Property Crime: 5%; Violent Crime: 9%.
St. Clair County Sheriff's badge

Incidents by Station

MetroLink Station 2020 2021
East Riverfront 2 2
5th & Missouri 6 8
Emerson Park 4 8
Jackie Joyner-Kersee 2 2
Washington Park 3 2
Fairview Heights 11 16
Memorial Hospital 2 1
Swansea 1
Belleville 1
College 1
Shiloh-Scott 5
Alignment
TOTAL 36 41

St. Clair County Incidents

2021-Q3 St. Clair County Incidents Graph for years 2020 and 2021.
MetroLink Task Force Summary

Task Force Incidents

2020 2021
Quarter 1 206 139
Quarter 2 68 143
Quarter 3 128
Quarter 4 103

Offense Types

2021 Q2 MetroLink Task Force Summary Pie Chart. Standard of Conduct: 77%; Property Crime: 2%; Violent Crime: 20%
  • MetroLink boardings increased 18%
  • Incidents per MetroLink boarding is .00010 (10 incidents per 100,000 boardings)
  • 57 of incident reports were the result of self-initiation/pro-active policing
  • Weapon violations account for 61 of the violent offense types. Likely the result of pro-active initiatives targeting known ‘hot spots’
  • The majority of standard of conduct offenses are drug and fare violations

MetroLink Task Force Incidents

2021-Q2 MetroLink Taskforce Summary Incidents Chart for years 2020 and 2021
St. Louis County police badge

St. Louis County Incidents

2020 2021
Quarter 1 111 84
Quarter 2 18 91
Quarter 3 76
Quarter 4 63
  • St. Louis County MetroLink boardings increased 13%
  • Incident per MetroLink boarding is .00018 (18 incidents per 100,000 MetroLink boardings)

Offense Types

2021-Q2 St. Louis County Pie Chart. Standard of Conduct: 79%; Property Crime: 3%; Violent Crime: 18%
St. Louis County police badge

Incidents by Station

MetroLink Station 2020 2021
Shrewsbury 2
Sunnen 2
Maplewood 1 3
Brentwood 1
Richmond Heights 1
Clayton 2 3
Forsyth 1
U-City/Big Bend
Skinker
Lambert Main 1
Lambert East
North Hanley 10 54
UMSL North
UMSL South 9
Rock Road 7
Wellston 2 7
Delmar Loop 1
Alignment 2
Total 18 91

St. Louis County Incidents

2021-Q2 St. Louis County Incidents Chart for years 2020 and 2021.
St. Louis Metropolitan police badge

St. Louis City Incidents

2020 2021
Quarter 1 36 21
Quarter 2 22 10
Quarter 3 16
Quarter 4 19
  • St. Louis City MetroLink boardings increased 25%
  • Incident per MetroLink boarding is .00002 (2 incidents per 100,000 MetroLink boardings)

Offense Types

2021-Q2 St. Louis City Pie Chart. Standard of Conduct: 73%; Violent Crime: 27%
St. Louis Metropolitan police badge

Incidents by Station

MetroLink Station 2020 2021
Shrewsbury 1
Skinker 1
Delmar Loop 1
Forest Park 4 1
Central West End 3 1
Cortex 1
Grand 5 2
Union Station 1
Civic Center 5 1
Stadium 1
8th & Pine 1
Convention Center
Landing 2 1
Total 22 10

St. Louis City Incidents

2021-Q2 St. Louis City Incidents Chart for years 2020 and 2021.
St. Clair County Sheriff's badge

St. Clair County Incidents

2020 2021
Quarter 1 59 34
Quarter 2 28 42
Quarter 3 36
Quarter 4 21
  • St. Clair County MetroLink boardings decreased 13%
  • Incident per MetroLink boarding is .00013 (13 Incidents per 100,000 MetroLink boardings)

Offense Types

2021-Q2 St. Clair County Pie Chart. Standard of Conduct: 67%; Violent Crime: 33%
St. Clair County Sheriff's badge

Incidents by Station

MetroLink Station 2020 2021
East Riverfront 1 2
5th & Missouri 4 9
Emerson Park 4 7
Jackie Joyner-Kersee 2 1
Washington Park 2 4
Fairview Heights 8 13
Memorial Hospital
Swansea 1 1
Belleville 1 3
College 1
Shiloh-Scott 2 1
Alignment 3
Total 28 42

St. Clair County Incidents

2021-Q2 St. Claire County Incidents Chart for years 2020 and 2021.

Definitions:

Incident: an event where one or more offenses are committed by the same offender(s) at the same time & location.

Incident Report: unofficial documentation of a security-related incident, completed by officers on the MetroLink Task Force; not the official crime report, please contact the individual police departments for official data.

Offense: criminal offense(s) that occur during an incident.

Offense Types: (Warrant arrests are not included in the offense categories)

Standard of Conduct Violations: crimes that are less serious, but that profoundly affect passengers’ perception of security and that consume a disproportionate amount of time and resources available to transit police and security forces (e.g., curfew & loitering laws, disorderly conduct, fare evasion, drug abuse violations, driving under the influence, drunkenness, sex offenses, trespassing).

Property Crimes: crimes that involve the property of the transit agency or the personal property of passengers & employees property  (e.g., arson, burglary, larceny/theft, motor vehicle theft, vandalism).

Violent Crimes: all crimes that passengers/employees generally consider a potential threat to their personal safety (e.g., assault, homicide, rape, robbery, suicide/attempted suicide, weapons violation).

Proactive Policing: police work that deters crime, reduces disorder, reduces fear of crime, or remedies specific concerns in a given area; police action that occurs before a crime is committed

Contact to Listing Owner

Captcha Code